ADP® DataCloud
Unify, enhance and understand your people data better. ADP DataCloud’s AI-powered analytics can help you drive growth throughout the employee lifecycle and transform your workforce in meaningful ways.

Empower your HR team with actionable insights
Consolidate data across your payroll and HR systems, gain a clear view of your workforce with AI-driven analysis, and benchmark your performance against industry peers. Leveraging these ADP DataCloud capabilities can help you realize impressive results, much like other ADP clients:
![]() 27 days average decrease in time to
27 days average decrease in time to
hire for 50% of ADP metric users1
![]() 60% of organizations using ADP’s
60% of organizations using ADP’s
turnover cost storyboard lowered
their voluntary turnover costs2
![]() 55%+ of organizations using ADP’s
55%+ of organizations using ADP’s
metrics reduced their overtime costs3

Six business outcomes with HR data-driven insights
Learn how data can transform your workforce.
Get answers to your critical people data questions
Quickly access metrics to analyze your workforce trends and help drive growth. You’ll know where to focus your efforts, how you compare to peers and how to respond directly from your ADP payroll and HR solution.
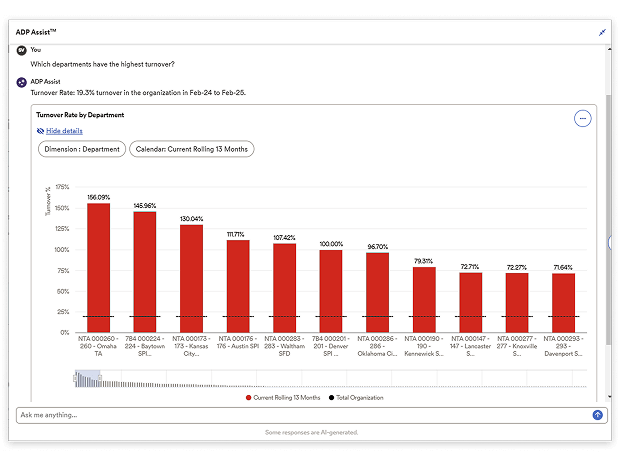
AI-Powered Analytics
Analyze data faster with the aid of artificial intelligence
Analytics enhanced by ADP Assist™ can help you access data directly within your flow of work and transform questions into actionable insights in seconds.
- Accelerate your knowledge: Get answers quickly and say good-bye to mining through various layers of data or complex metric configurations.
- Access data easily: Ask for insights via an intuitive, conversational experience that anyone can use.
- Streamline workflows: View metrics anywhere within your ADP platform without having to toggle to the analytics dashboard.
- Share and collaborate: Save, export and share data across your organization, and turn insights into action fast.4
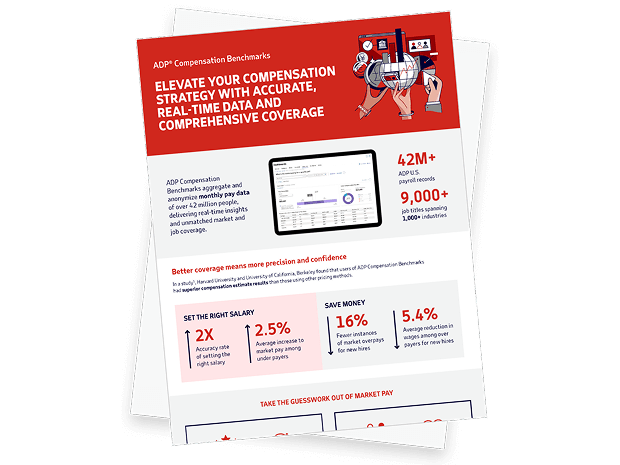
Industry-Leading Benchmarks
Use ADP’s data to your competitive advantage
See how you measure up to others with the industry’s largest workforce dataset. ADP benchmarks consist of up-to-date, aggregated and anonymized HR and pay data from our U.S. client base – 1 million employers with more than 39 million employees and 9,000+ job titles, spanning 1,000+ industries.
Access a range of benchmarks based on 30+ metrics, including:
- Compensation
- Time and attendance
- Workforce demographics
- ADP system usage
Quick and Easy Setup
Turn-key analytics at your fingertips
Start analyzing workforce data within minutes of implementation. DataCloud comes with preconfigured key performance indicators (KPIs) based on industry standards, such as turnover, head count and labor expenses.
You can also customize dashboards to fit your unique specifications. Build them once and then schedule automatic updates and delivery to key stakeholders. Your executives will always have the latest metrics available without any additional effort required on your part.

Discover the power of workforce data
Experience for yourself what ADP DataCloud can do for you.


Real Income
Want access to ADP’s powerful benchmark data but don’t use ADP payroll or HR software? No problem. Unlock the power of accurate, real-time compensation insights with Real Income – a standalone benchmarking solution built for organizations using other HCM solutions. Real Income also offers data licensing so you can analyze metrics in a way that suits your business needs.
.png?rev=1a0c3639324046de8f8598dc74768b89&hash=E860F7F41A3E2A60488A5EEA8C464973)
MEET OUR CLIENTS
ADP DataCloud helps us analyze and give people access to our data. We’re able to see and forecast our needs of the business before they’ve even happened. That allows us to make important decisions about our business that can reduce our spend and improve our customer service ratings.
Daniel Varela Vice president of payroll, benefits and compliance, Camping World

MEET OUR CLIENTS
I use DataCloud because it’s wonderful. I wish I could shout it from the roof — it’s that amazing. It has validated everything that I do and it gives my senior team and our board reason to know that I know what I’m talking about.
Christine Ellinger Chief Human Resources Office & Senior Vice President, Central Trust Bank

MEET OUR CLIENTS
With our previous system, it was a horrible process trying to extract data to get turnover or overtime rates. Now that we use ADP, we can pull that data on a daily or even hourly basis, and we look at it all the time. To be able to have a system that actually shows us that in real time has saved me months of work.
Ronn Alexander Director of Human Resources, Ewing Irrigation

Complimentary virtual summit
Women at Work 2026: Redefining the workforce of tomorrow
Available on demand.
Strategies to help women and their allies manage personal and professional growth, AI and leadership at work. For HR and business change-makers.


Resources and insights

insight
Achieving success with people analytics

guidebook
People analytics handbook

guidebook
Making a difference with people analytics
1 Data compiled from clients using time-to-fill metrics that have seen a reduction in average time-to-fill from July-September 2022 to July-September 2023. Results may vary.
2 Data compiled from active Turnover Cost storyboard users that have seen a decrease in turnover costs from July-Sept 2022 to July-Sept 2023. Results may vary.
3 Data compiled from clients using overtime metrics that have seen a reduction in overtime costs from July-Sept 2022 to July-Sept 2023. Results may vary.
4 Must have Enhanced Insights to access.